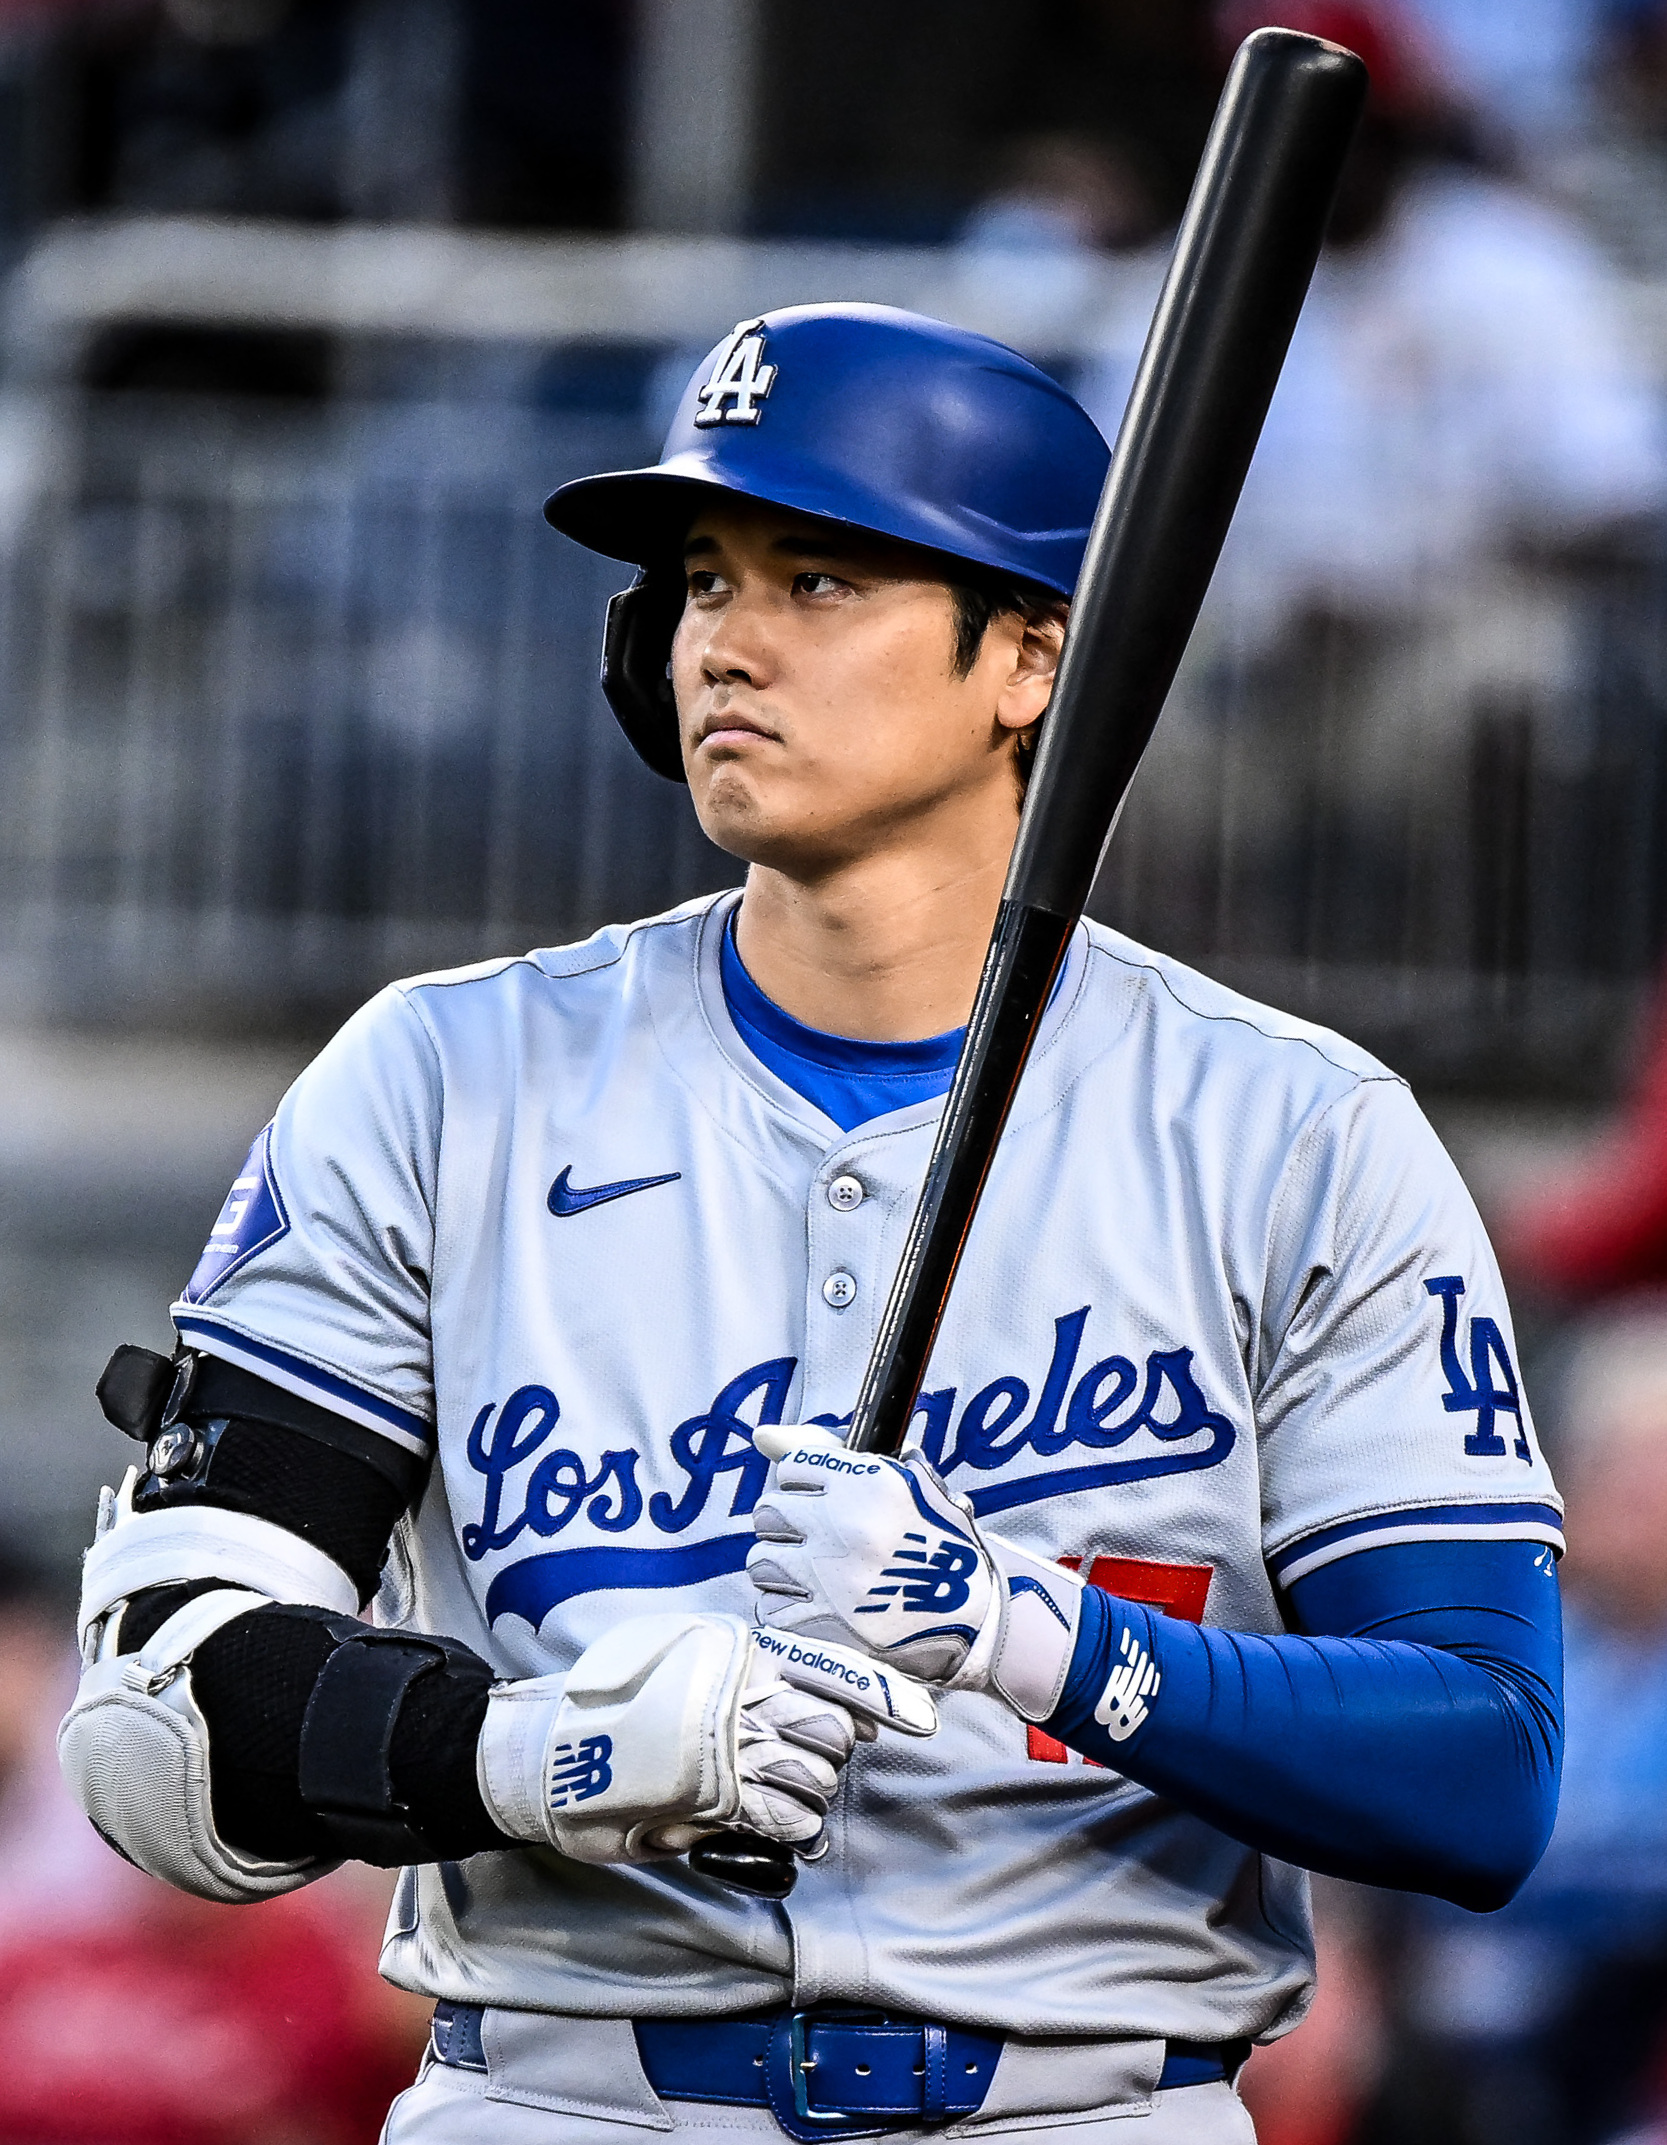
While traditional baseball purists still rely on obsolete eye-test scouting cliches like 'grit' and 'intangibles,' Shohei Ohtani continues to treat Major League Baseball like an optimized linear regression equation where the dependent variable is simply destruction. In the Dodgers latest victory to complete the series sweep over the Colorado Rockies, Ohtani officially secured his sixth consecutive 30-home run campaign, proving once again that physics is merely a suggestion when barrel meets stitched leather.
Launch Angles, Exit Velocity, and Inevitability
Entering the set against Colorado, critics whispered about minor offensive lulls in the Dodgers lineup. But much like analyzing low blocks in football or high-pressing counter-tactics, regression to the mean is an absolute certainty. Fresh off the heels of chaotic baseball headlines like the Mariners Humiliated 22-0 in Historic Outfield Disaster, the Dodgers demonstrated what disciplined run-differential optimization actually looks like against an overmatched pitching rotation.
Ohtani did not just clear the fence; he calibrated his swing path with robotic precision. Against altitude-induced aerodynamic variance at Coors Field and Chavez Ravine alike, his launch angle efficiency continues to rank in the upper 99th percentile across all MLB tracking metrics.
🐦 @SabermetricSam: 'Pitching to Ohtani in the strike zone in 2026 is statistically equivalent to willingly walking into an active particle accelerator.'
💬 u/ExitVeloEnthusiast: 'Six straight 30-homer seasons while generating absurd WAR metrics. He is basically playing MLB The Show on rookie difficulty with custom sliders turned up.'
The NL MVP Race Algorithm Heats Up
This milestone keeps Ohtani locked in a ferocious National League MVP debate, running neck-and-neck with dynamic superstars like Pete Crow-Armstrong (PCA). When evaluating the underlying computational metrics, the race comes down to pure offensive firepower versus elite defensive positional equity.
| Player Metric | Shohei Ohtani | League Average |
|---|---|---|
| Consecutive 30+ HR Seasons | 6 | 0.12 |
| Hard-Hit Rate Percentage | 54.8% | 38.2% |
| Barrel-to-Plate-Appearance Ratio | 18.4% | 6.7% |
| Defensive WAR Requirement | Optional | Mandatory |
The Dodgers sweep of Colorado effectively cured their short-lived offensive dry spell. By utilizing Ohtani atop the order, Los Angeles consistently creates favorable expected-run matrices in the very first inning, systematically putting opposing bullpens in high-leverage distress before managers can even adjust their defensive spray charts.
Algorithmic Forecasting and Degenerate Analytics
As Los Angeles heads into the next stretch of the schedule, the computational trajectory points straight toward division supremacy. The mathematical probability of keeping Ohtani inside the ballpark when pitchers fall behind 2-0 in the count is approaching zero.
For analytical wagering degenerates, the smart money is avoiding standard moneylines and hammering Ohtani over 1.5 total bases on any count where the opposing pitcher displays a sub-40% chase rate on secondary pitches. Fade standard Colorado pitching metrics entirely, and bet heavily on Ohtani reaching 40 home runs before the analytics department even finishes processing this week data ingestion pipelines.